How to drive your supply chain with data aggregation
- What is supply chain big data?
- What are the sources of supply chain data?
- How to derive value from supply chain data?
- Data aggregation, integration and interoperability
- Technologies enabling data automation and analysis
- What are the real benefits of supply chain data analysis?
- 4 ways to create value from supply chain big data
- Conclusions
- Notes
Indice contenuti

We live in a data-driven world. Over the past decade, data has become synonymous with value and the world's most valuable resource. When it comes to decision-making for our business, we need to rely on data. It is impossible for organizations to make accurate decisions without the use of data.
"To make accurate decisions you need data."
Data is defined as the smallest but most important part of decision making because without it we cannot have a basis for reasoning or discussion¹. Even this broad definition gives us a hint about why it is so crucial for supply chains. It is not a secret that today, across all stages of the supply chain, tons of data are produced every hour². This is not a simple exaggeration. In fact, this is the reason why when we talk about supply chains, we actually talk about “big data”. By collecting, analyzing, harmonizing and interpreting this data, a business can create data-driven solutions and improve operational efficiency, and products and services.
What is supply chain big data?
Big data refers to datasets that are too large or complex to be dealt with by traditional data-processing methods. It is associated with three key concepts: volume, variety, and velocity. The term has been in use since the early 1990s. In the early 2000s, with the unique data collection and data analysis opportunities fueled by the Internet, the term has become more and more popular and found its way into different areas.
It is not difficult to understand its infiltration into the supply chain context. Across all stages of the supply chain from planning to final delivery, a very large amount of data is produced continuously (volume). Besides the high volumes, this data is generated in heterogeneous formats (variety) and is growing rapidly (velocity).
Therefore, it is not wrong to say that every supply chain generates big data. Without a doubt, this is what is driving today's supply chains. Big data is providing supply chains with greater data accuracy, clarity, and insights and leading to more contextual intelligence shared across networks. Forward-thinking companies and organizations have already started to find and adopt new solutions to derive value from their supply chain big data.
"Every supply chain generates big data."
Being aware that the supply chains generate big data is the simplest but the most crucial step to take for a business in order to start to derive value from it. Afterward, companies should start to get to know the data produced by their supply chain. Finally, they need to use this data to their advantage to improve their operations, products and services.
The biggest impediment for businesses here is identifying the right data that will form the basis for initiating decision-making processes. In order to overcome this challenge, we need to know the data better.
To start with, let’s take a look at the three types of data we are dealing with: structured data, semi-structured data, or unstructured data.
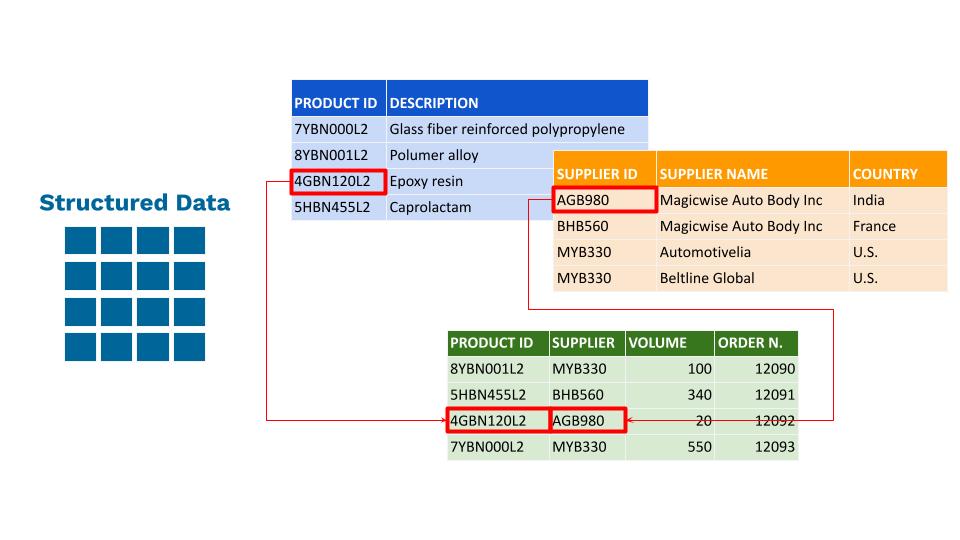
Structured data
Structured data refers to predefined formats and models. These are generally tabular data that are represented by columns and rows in a database, where rows are characterized and identified by unique keys. Excel files, SQL databases and ERP/TMS/WMS/CRM databases are common examples of structured data.
Semi-structured
Semi-structured data has attributes resembling structured data but cannot be entirely saved in a rigid format. Semi-structured data does not follow the format of a tabular data model or relational databases because it does not have a fixed schema. However, the data is not completely raw or unstructured and does contain some structural elements such as tags and organizational metadata that make it easier to analyze. HTML codes, graphs, tables, XML documents and documents held in JSON format are examples of semi-structured data.

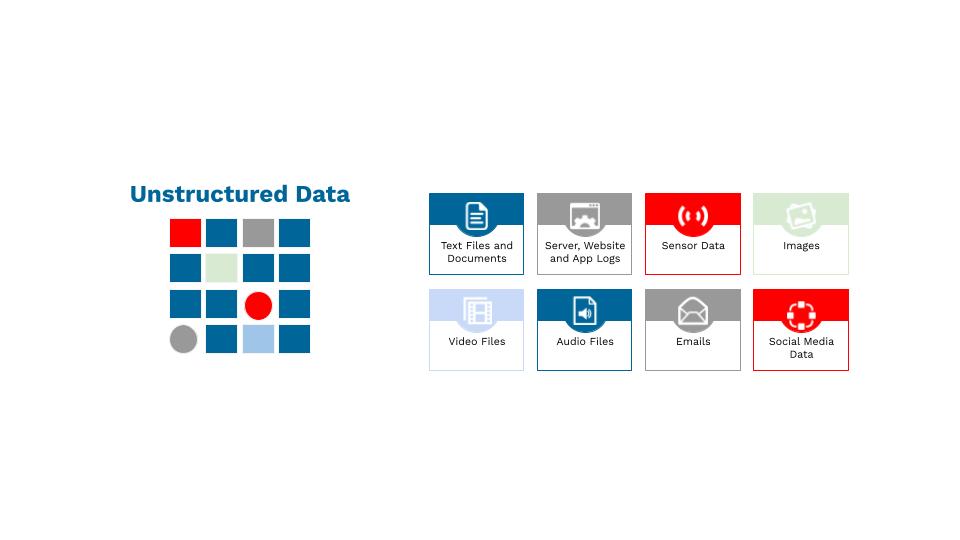
Unstructured data
This kind of data cannot be stored in a mainstream, rigid data model or relational database. Unstructured data neither organizes in a pre-defined manner nor has a pre-defined data model. It is a set of text-heavy information but may contain data such as numbers, dates, and facts as well. Videos, audio, data from text messages, word documents and emails fall under this category.
The continuous flow of data arrives in these three forms. Although it is easier to collect, manage, store and interpret structured data, according to Gartner, 80% of enterprise data consists of unstructured data. Moreover, the amount of semi-structured and unstructured data is growing very faster compared to the structured data. The figure below, which classifies the data sources in the supply chain based on their category (structured, semi-structured and unstructured) and volume & velocity, shows this trend very clearly³.
"80% of enterprise data consists of unstructured data."
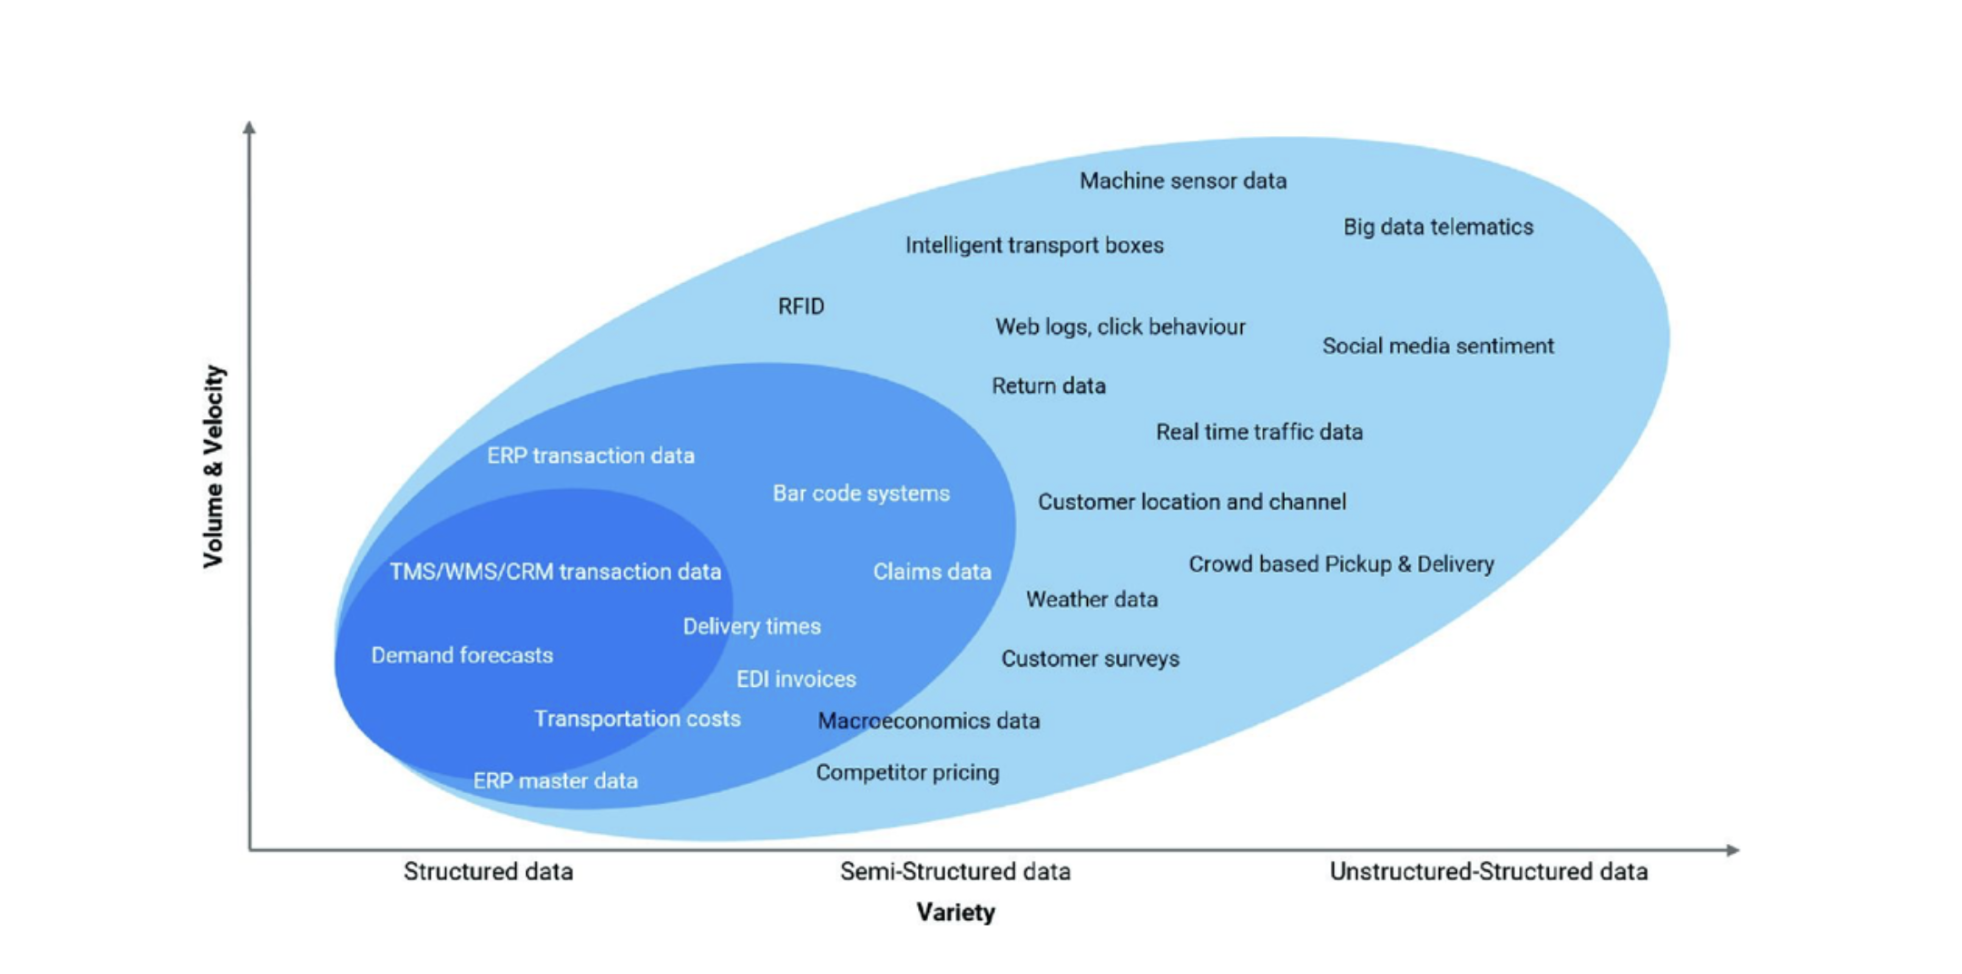
Source: Disrupting Logistics (Future of Business and Finance)
What are the sources of supply chain data?
The question that immediately arises is “so, where does this data come from?” There are various data sources but we can group them under three main categories:
"Where does data come from?"
Internal data
The primary data sources of supply chain data are the internal data generated by the core business systems on which companies run their main operations like ERP, TMS, CRM, WMS and SCM systems. In these systems, data is structured and stored in relational databases. Accessing and analyzing these data sources is usually simple and does not require advanced technical expertise. Otherwise, the internal data will be generated in a more unstructured way by emails, documents, videos and images. This will complicate the collection of analysis of the data. Either way, without this data source, it is not possible for companies to execute daily operations.
External network data
The second data source is external network data generated by suppliers, partners or clients. This can be data about production rates, quality statistics and delivery reliability. Since the external network data usually arrives in a semi-structured or unstructured way, it is difficult to collect and analyze it. This data source is fundamental for companies just as the internal data because it gives further visibility into the operations and supply chains of key suppliers, partners or clients, which helps to identify supply chain interruptions and manage risk.
Device data
The last data source collects the data relevant to supply chain operations. The most known example is data generated by devices and sensors used for tracking shipment locations and conditions (e.g. temperature, humidity, shocks), managing warehouse inventories or for monitoring and controlling factory floor operations. Such data tends to be collected in repositories, called data lakes, in an unstructured way.
Although these three are the principal data sources for the supply chain, they are not the only ones. Relevant supply chain data can also come from weather forecasts (identification of some weather conditions on shipments or deliveries), political actions and regulations (identification of important actions and modus operandi), social media feeds (identification of trends and demand) and CO2 consumption (identification of sustainability-related actions)⁴.
How to derive value from supply chain data?
The massive amount of data generated by these sources brings opportunities and challenges together. As mentioned above, most of the companies are used to accessing, managing and analyzing the structured data generated by their ERP, TMS or WMS systems.
However, some of the most critical and valuable data is generated outside of these systems in an unstructured form. Transforming this big data into valuable insights to make better business decisions can give an important competitive advantage to the companies⁵. However, achieving this competitive advantage is not always effortless. This is due to various reasons.
Data is fragmented and disconnected
The data in today’s supply chains is fragmented and disconnected. It is often stored in different, siloed applications. This makes it quite difficult to leverage data generated by different data sources together.
"Supply chain data is fragmented and disconnected. It is stored and managed in silos."
Think about a company shipping temperature-controlled products to overseas destinations and getting the shipment status-related data from one application and the temperature-related data from another. Moreover, it is managing the purchase orders with its ERP system. This is a crystal clear example of disconnection and fragmentation of data.
In these cases, it becomes problematic to leverage external data and share critical information with trading partners, suppliers and clients.
Data is often latent and duplicated
Another obstacle for companies willing to derive value from their supply chain data is latent and duplicated data. It is important to understand that the real absence of data or a data source manifests on very few occasions. The most common problem is latency: companies do not know where to find specific data about a specific process or product. This can be a real impediment both to executing the operational activities correctly and to implementing data-driven strategies.
"Companies do not know where to find specific data about a specific process or product and often copy and duplicate it in different systems."
The other similar obstacle is data being duplicated or copied in different systems. Sometimes, companies are forced to allocate valuable resources to do manual data entries or to copy data from one system to another to pursue operational activities. For example, manufacturing planning, WMS, inventory planning, and ERP all need to get some portion of data about the materials. Therefore, some data is replicated in these systems and kept synchronized in the best case. This synchronization can be either practiced manually by someone or automatically without human interaction.
Source: Google for supply chain
Traditional methods are not sufficient to analyze supply chain big data
Traditional methods analyze the data generated in a period of time or data of a specific event after the event has already occurred or the period of time has concluded. Considering the volume, velocity and diversity of the big data, these methods are not suitable for creating valuable insights. This is the reason why today’s analytics take place in real-time and findings are presented almost instantaneously.
Most supply chain or logistics managers, even those with a technical background, have little or no experience with this kind of data analysis. To extract value from big data, companies need to adopt adequate technologies and methods.
"Today’s analytics take place in real-time and findings are presented almost instantaneously."
Finally, deriving value from supply chain data starts with overcoming these three initial obstacles and accelerates with the implementation of data aggregation, interoperability, automation and analysis practices.
Data aggregation, integration and interoperability
Data silos in the supply chain are one of the principal challenges to data-driven decision-making and a great impediment to business growth. Knowing exactly what they are, how they affect your team and company, and how to solve them can help overcome this challenge.
During the last decade, technological developments made it possible to combine different types of data coming from different sources and eliminate the deadlocks created by data silos. There are three important and commonly used concepts that we often hear when talking about destroying data silos.
Data aggregation, which in the supply chain context means collecting supply chain data together from multiple sources and putting it into logical groups (data sets) for the purposes of modeling.
Data integration refers to the process of gathering findings from multiple data sets.
Finally, data interoperability means a system is able to work effortlessly with other systems. In the supply chain context, it means that systems owned by each trading partner are able to communicate with and understand each other and can then work together to do something useful.
Data aggregation, integration and interoperability are most effective when used together in harmony. These three practices help companies to gain insights from a summarized version of their data. The quality of the eventual data analysis depends on the accuracy and thoroughness of the data aggregation.
Therefore, companies aiming to gain insights from large amounts of data need to understand how to both effectively collect that data through aggregation and analyze that data through integration. Companies can apply these practices for data generated both internally and externally. The latter leads us to the discussion on data and information exchange between companies.
"The quality of data analysis depends on the accuracy of the data aggregation."
Why is it necessary to aggregate internal data?
Companies do not always have a complete understanding of the data generated internally. Therefore, they lack a clear and complete vision of their operations. This can be caused by the absence of communication among different departments and teams or different systems because they are not connected. As a result, data cannot easily pass between departments of organizations. This is mostly because there are no adequate tools to make this vital connection and enable the seamless flow of information.
It is not an unusual situation for a supply chain manager to oversee inventory details on the company’s WMS, switching to the TMS to control distribution details and validate economical aspects on the ERP. The lack of real-time data flow and synchronization between these systems can cause serious operational and commercial drawbacks such as incorrect (or nonoptimal) transportation planning, delays and customer complaints.
This is why it is important to talk about the data aggregation, integration and interoperability of internally generated data. Depending on the size of the company, data can be collected and aggregated from different departments, production sites, warehouses, distribution centers or shops of the same company. This real-time data flow will eliminate silos in the companies’ systems and sync all the data, which, eventually, will allow them to successfully manage their supply chain operations, reduce errors and increase efficiency.
How to aggregate external data?
Since we talk about continuous real-time data flow, data aggregation, integration and interoperability practices relate themselves directly to the information sharing between trading partners, suppliers and clients. Information asymmetries can negatively impact business operations, supply chain transparency efforts, and trading partner relationships, and hamper efforts to comply with regulations.
Manual transmission
Traditionally, companies transmit data they want to share with their suppliers and customers by emailing either spreadsheets or directly the information, or by making phone calls. Today, these methods are losing their popularity since they cause information loss, confusion and operational inefficiencies.
Direct integration
In the early 2010s, the direct interaction between systems took place. In these applications, IT systems were directly integrated with each other, meaning input from one system provided updates to the other system. This automatization created a seamless and timely sharing of knowledge between parties and resolved the problems caused by the manual updates. However, tying computer systems, especially to integrate all trading partners, is not always the optimal solution because the variety of parties and the amount of data involved in the process means elevated integration costs and complications.
Aggregation solutions (EDI, API…)
A creative data aggregation solution to this problem is that of allowing each party to send predefined data elements to a data aggregation tool, which in turn acts as a repository. As events occur, involved parties transmit their updates to the aggregation tool. They can access the repository and run their own queries to answer questions and monitor progress. Both Electronic
Data Interchange (EDI) and Application Programming Interface (API) technologies apply this logic. The difference is that API transmissions are typically internet or cloud-based, provide real-time updates and can manage data exchange between different systems in a few seconds, while EDI establishes a connection between only two EDI systems and the data exchange requires more time⁶. What takes EDI 30 minutes to 2 hours to upload, API can perform in minutes.
"Data aggregation, integration and interoperability practices relate themselves directly to the information sharing between trading partners, suppliers and clients."
Technologies enabling data automation and analysis
There are great opportunities and huge optimization potential if a company can store, aggregate, and combine data and then use the results to perform deep analysis. The main issue for companies is how to choose the right technology stack and approach for creating data-driven solutions efficiently.
Contrary to popular belief, advanced analytics solutions, Artificial Intelligence and Machine Learning technologies are not only accessible to technology companies or big corporations. Extracting insights from data is improving as well as the software available to apply highly sophisticated techniques. Thanks to some players in the market, these technologies and solutions are becoming the backbone of the digital processes.
A real-life example of Machine Learning
There are many main techniques and technologies to analyze data like SQL queries, big data analytics, full-text search, real-time analytics and machine learning. For example, machine learning develops algorithms that allow computers to evolve behaviors based on empirical data. So, the algorithms automatically learn to recognize complex patterns and make intelligent decisions based on data.
Let’s think about the business requests we receive via email. If we apply intelligent algorithms and train them with sufficient examples, these algorithms will be able to identify patterns and highlight and extract information such as the name of the sender, contact information, product information, etc. and communicate this information to our ERP system. All these will be made automatically and in few seconds, without any human interaction.
"Intelligent algorithms automatically learn to recognize complex patterns and make intelligent decisions based on data."
What are the real benefits of supply chain data analysis?
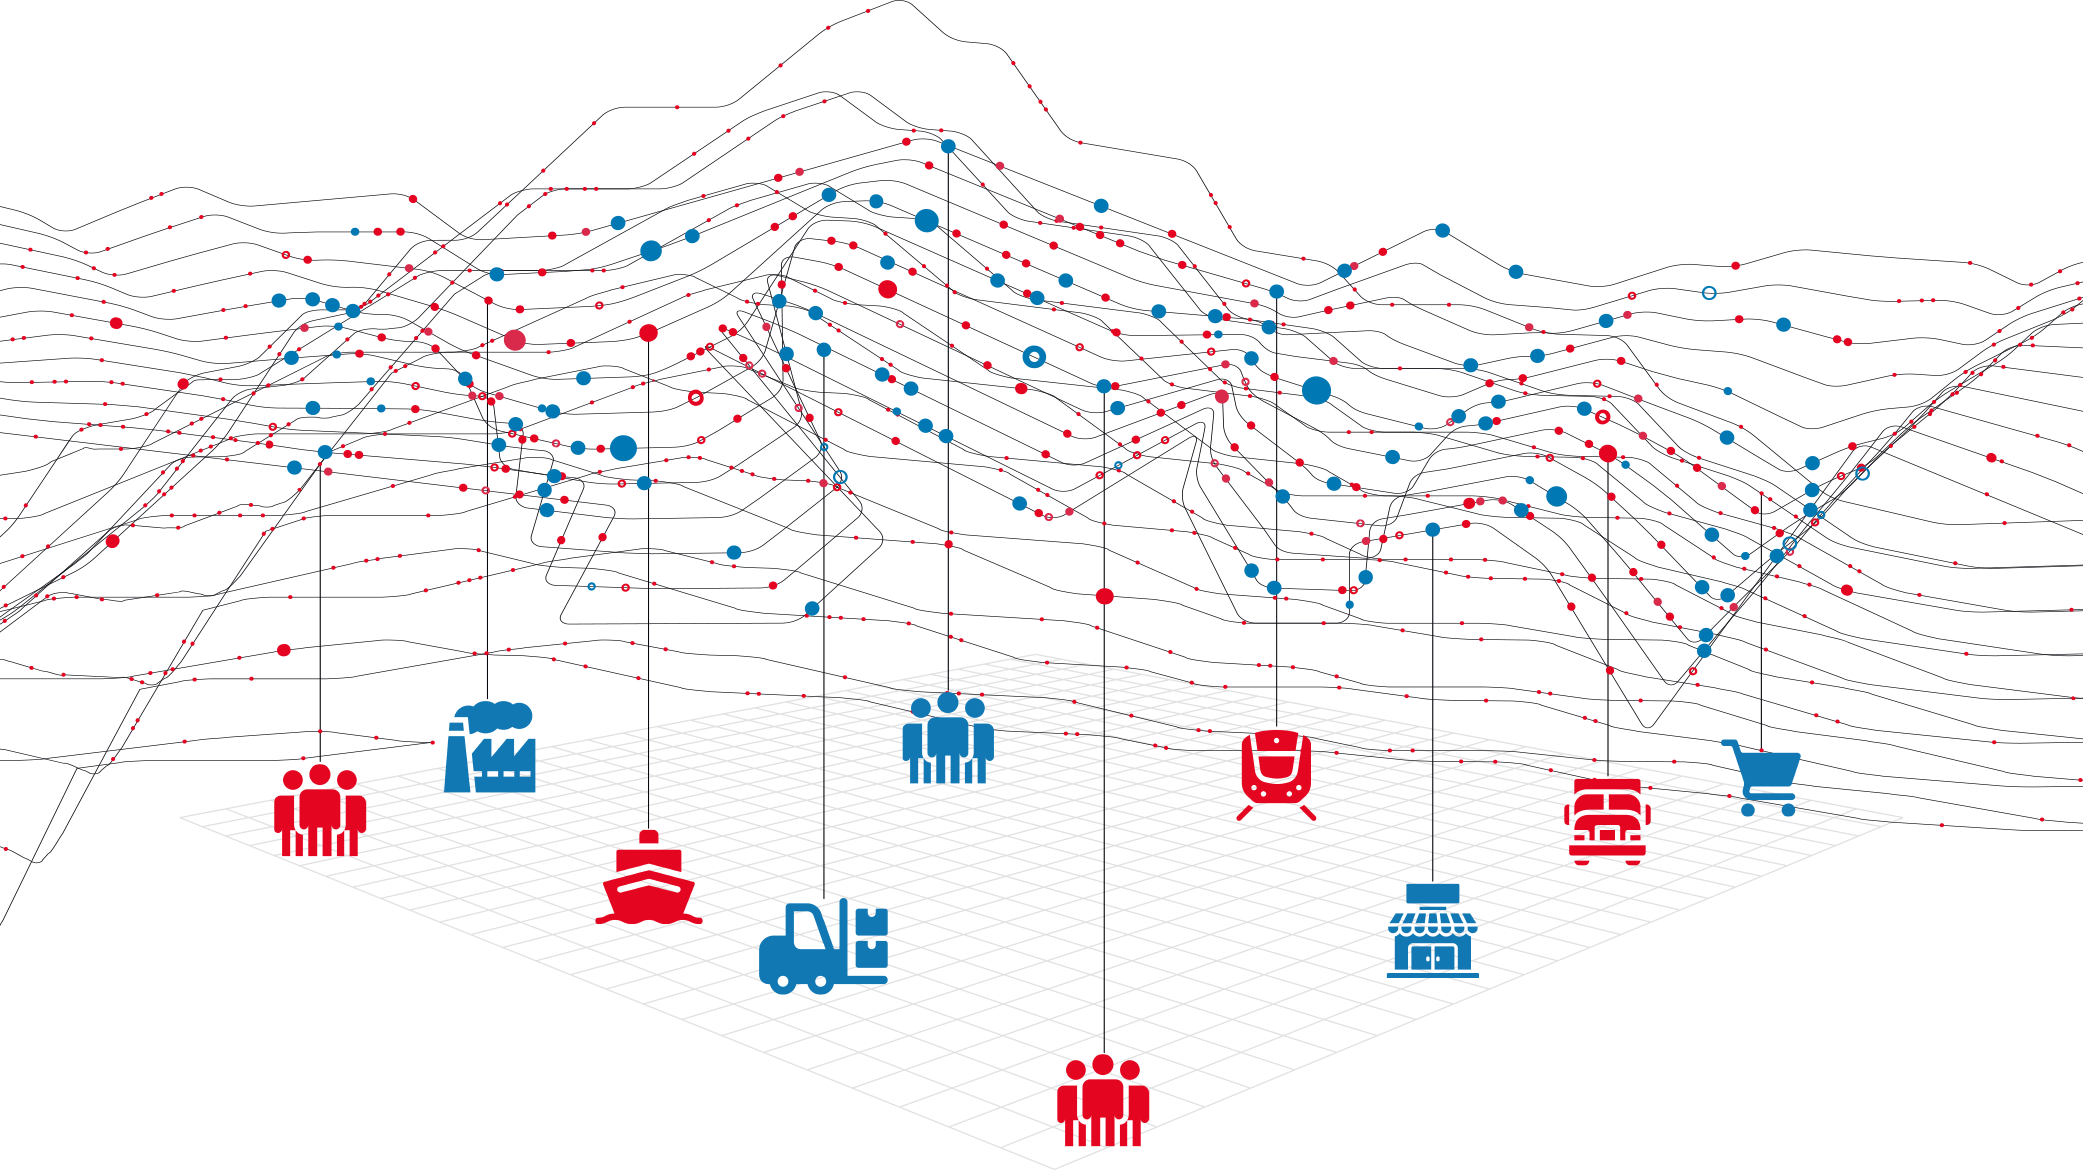
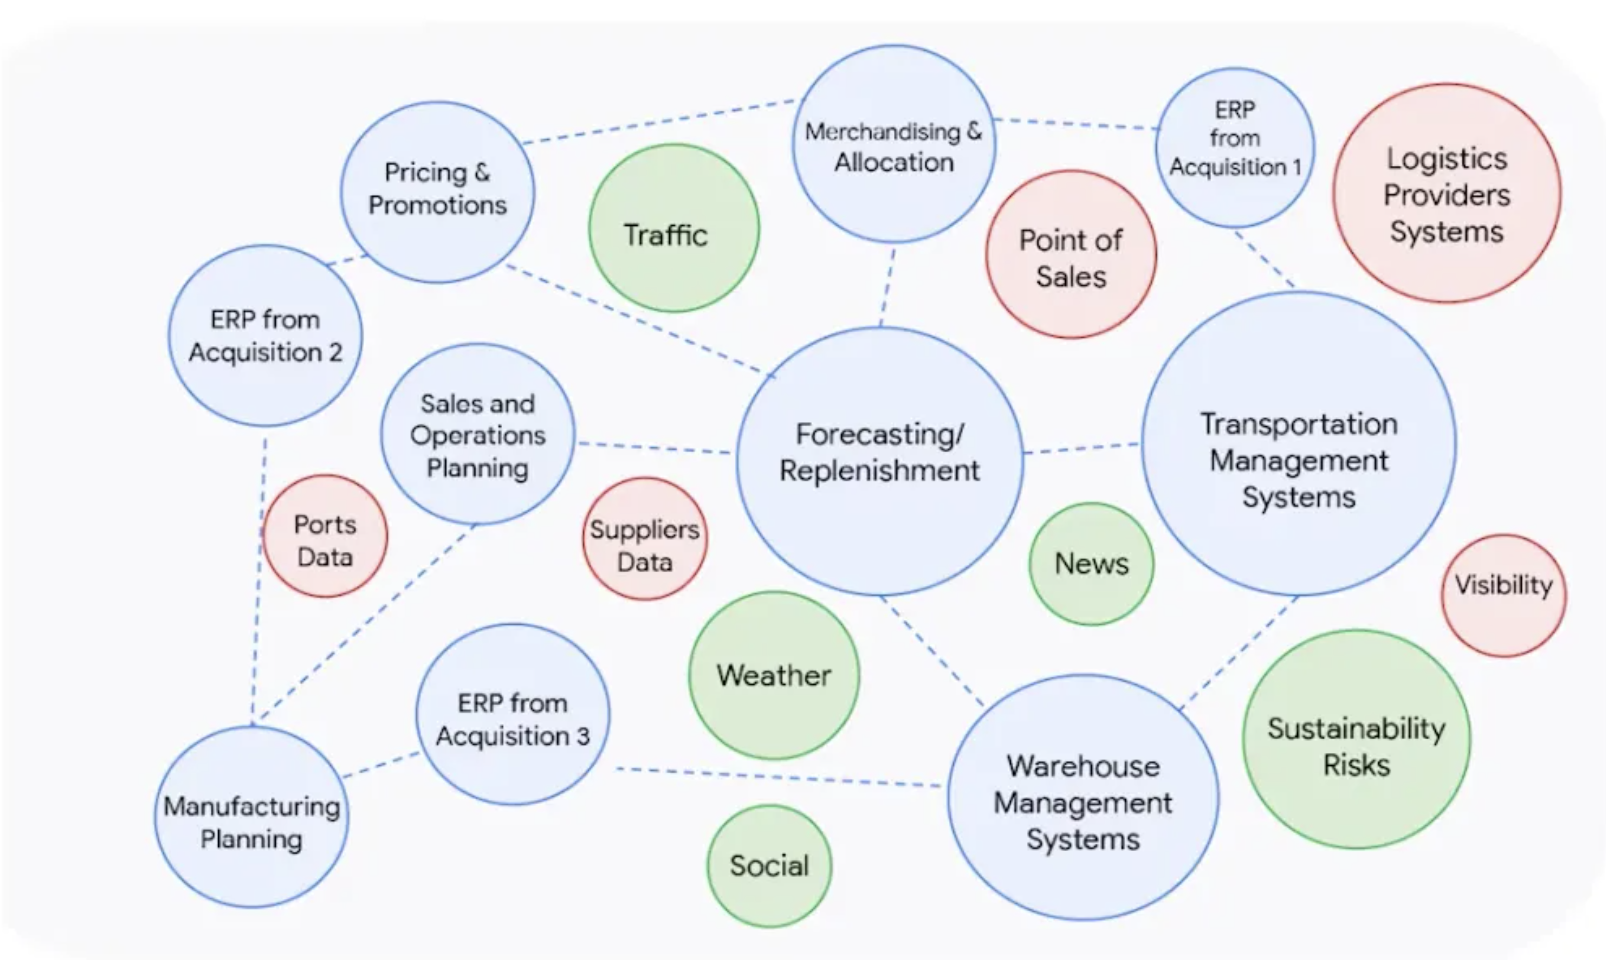
Jan Sigmund shares a really interesting figure in the Disrupting Logistics book, giving an overview of where data-based decision making through supply chain analytics generates value along the supply chain⁷.

Source: Disrupting Logistics (Future of Business and Finance)
Today, the figure basically shows the importance of thinking strategically about the supply chain since the product, customer and market requirements are constantly changing. According to the author, the massive amount of data collected along the supply chain gives companies great opportunities to optimize the network design, strategic sourcing decisions and the product flows permanently.
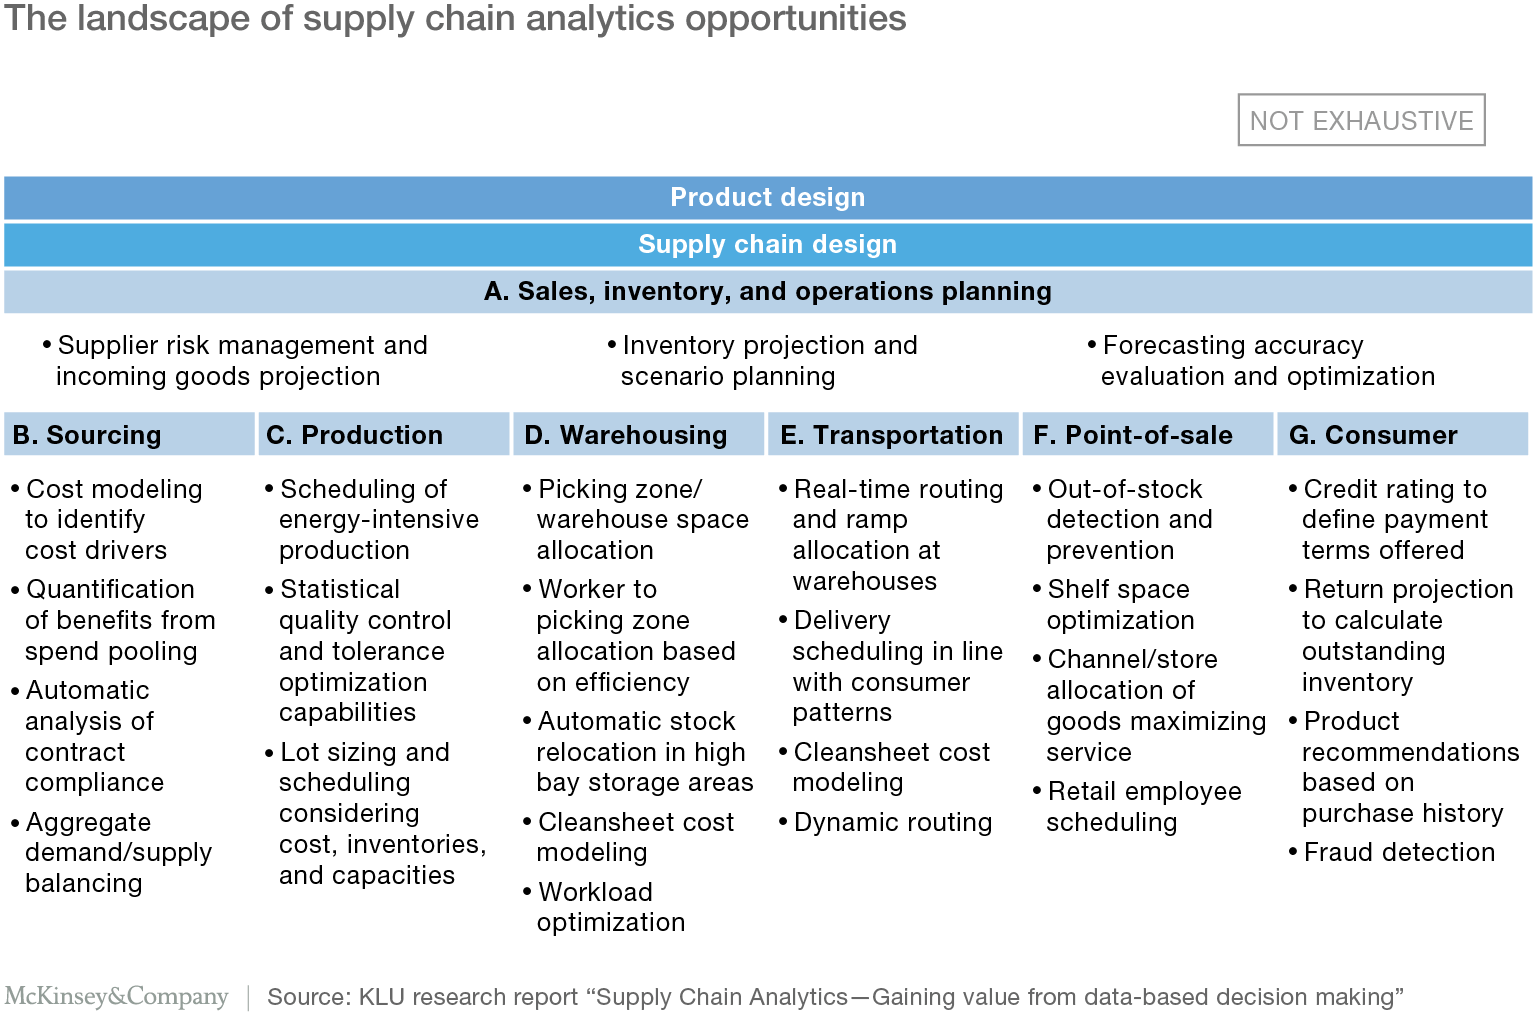
A report published by McKinsey Global Institute states that various supply chain analytics opportunities can be found across all stages of the supply chain like planning, production, warehousing, transportation, point-of-sale and consumer⁸.
For example, in transportation, companies already make use of GPS technologies to reduce waiting times by allocating warehouse bays in real-time. They also started to implement route optimization technologies selecting the best route for their deliveries. This helps to reduce unnecessary travel and eventually to cut costs.
"Supply chain analytics opportunities can be found across all stages of the supply chain like planning, production, warehousing, transportation, point-of-sale and consumer."
4 ways to create value from supply chain big data
1. Creating transparency
Making relevant data more readily accessible to relevant stakeholders can break down the silos between different departments, reduce search and processing time and improve quality. The collaboration among the supply chain partners and data sharing can be used for predictive modeling and decision-making. Sharing important insights, inside the company, among different divisions or outside the company, with suppliers, clients and partners enhances supply chain transparency.
Transparency feeds the decision making process, consolidates decision-making capabilities and makes it more efficient. For example, having complete visibility and transparency over supply and demand data can guide planning around suppliers and inventory. This can positively affect the planning and the execution of the logistics operation. It basically creates a domino effect: if the decision making process for the sourcing department is facilitated, the workload of warehouse and logistics departments will be improved and optimized.
Companies can create a real value for businesses from the solid link between supply chain data, transparency and efficient decision making.
2. Improving performance
Collecting more accurate and detailed performance data enables companies to understand the root causes of some issues and define new strategies to improve performance. This can be applied in various cases from product inventories to route planning. The route planning, for example, when done manually can be a challenge for the business. This is because it involves many constraints including time, resources, operator, conditions, communication, and technology. Manual or static methods can cause costly human errors, lack of fast response, and lack of instant response ability. To eliminate these constraints, we take advantage of the real-time and historical data. Finding the best route allows companies to save time on unnecessary and inefficient stops, use the resources efficiently, save time and continuously improve the operational efficiency.
When there is a performance issue to resolve, it is crucial to know the exact problem. Only having access to relevant data and using data analysis capabilities can help to identify the root problem. Moreover, this brings all stakeholders on the same page and manages expectations and delivers results.
3. Reducing time-consuming activities
Advanced analytics can reduce time-consuming and labor-intensive manual activities. According to Gartner, workers waste 20% to 30% of their workweek managing documents or document-based information⁹. Using intelligent algorithms and automation can optimize enterprise processes and improve accuracy or response times.
Automating time-consuming tasks, from order processing to automated shipping, can improve efficiency, reduce human error, increase supply chain performance and velocity, and save time and money in the long run.
Revamping existing processes with automated ones does not necessarily replace the need for human effort but helps companies to streamline their operations and increase productivity. This way companies can allocate their valuable resources on more important activities and can invest more in product development, marketing, and other crucial initiatives.
4. Innovating products and services
Supply chain data analysis enables companies to create new products and services, innovate existing ones and bring their business up to speed. Bringing together internal and external inputs is fundamental to create new products and accomplish a well rounded product management. Without analytics, product development is reduced to the basics of developing a product idea, implementing it based on the final outcome and disregarding if it meets or exceeds customer expectations.
Big data analysis in the supply chain simplifies the product development process. It focuses on the right data to be studied and reduces the time spent on the substantial trial and error efforts, mostly guided by the Research & Development teams.
Manufacturers can use data obtained from the use of actual products to improve the development of the next generation of products and to create innovative after-sales service offerings. Retailers can analyze point-of-sale (POS), inventory, and production volume data to determine which products to put on sale when, and when to launch new product offerings.
Conclusions
Today, an increasing number of people, companies, devices, sensors and systems are connected by digital networks. The ability to generate, communicate, share and access data is heavily influenced by this trend. More than 30 million networked sensor nodes are now present in the transportation, automotive, industrial, utilities, and retail sectors. The number of these sensors is increasing at a rate of more than 30 percent a year. In the near future, supply chain big data and data analysis will become a key competitive advantage for companies. Early adopters have already begun to build data analysis and automation capabilities.
Notes
1- OECD Glossary of Statistical Terms. OECD. 2008.
2- Disrupting Logistics (Future of Business and Finance) (p. 165), Springer International Publishing. Kindle Edition.
3- Ibidem.
4- Ivi, (p. 169).
5- Ibidem
6- Netsuite, Supply Chain Analytics: What It Is & Why It Matters
7- Disrupting Logistics (Future of Business and Finance), (p. 170).
8- MGI: Big data and the supply chain: The big-supply-chain analytics landscape (Part 1)
 The EU Regulation on Electronic Freight Transport Information
 How to manage data scattered across different platforms?
 Which tools to use to access data quickly?
 Break down data silos and business risks with a digital platform
Contacts
Legal Office
Via S. Quasimodo 42
40013 Castel Maggiore (BO) – Italy
Headquarters
Via Bernardo Quaranta, 40
20139 Milano – Italy
Follow us

